Thank you!
We will send the catalogue to the e-mail address you provided. In case you don't received it, make sure to check your SPAM folder.
Supreme
accuracy
Comfortable
testing
Multiple diagnostic
options
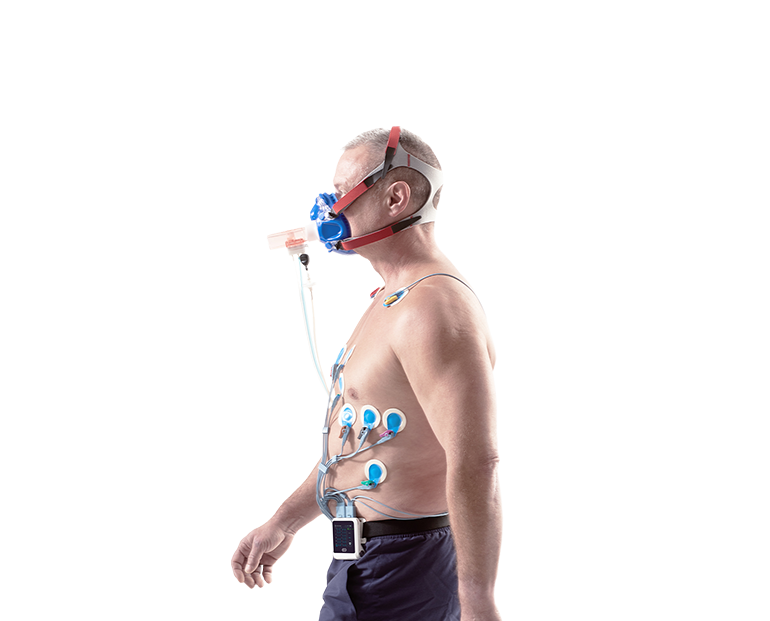
Accurate CO2 sensor zeroing, a flowmeter without any moving parts, and the prevention of gas sample mixing all combine to ensure excellent measurement accuracy.
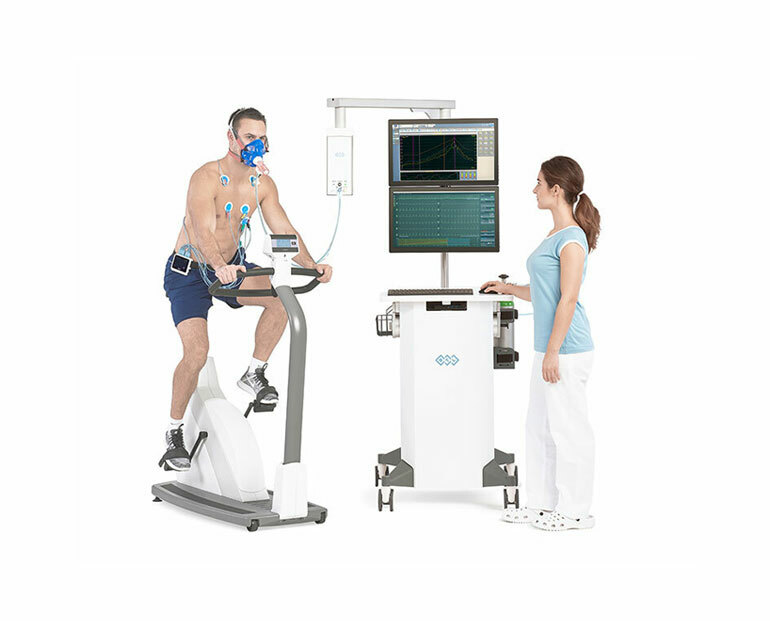
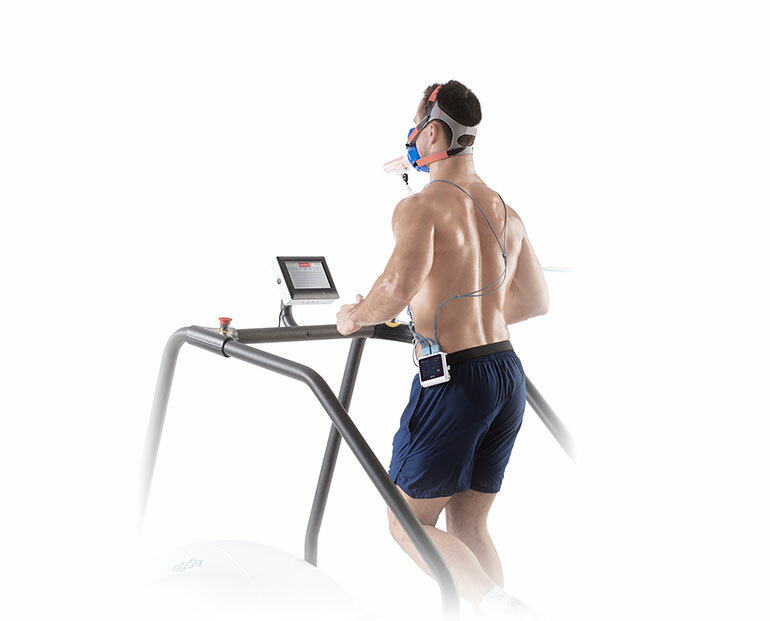
Straightforward calibration with wizard guidance, swivel arm, and automated predefined CPET protocols are what make your daily routine comfortable and convenient.
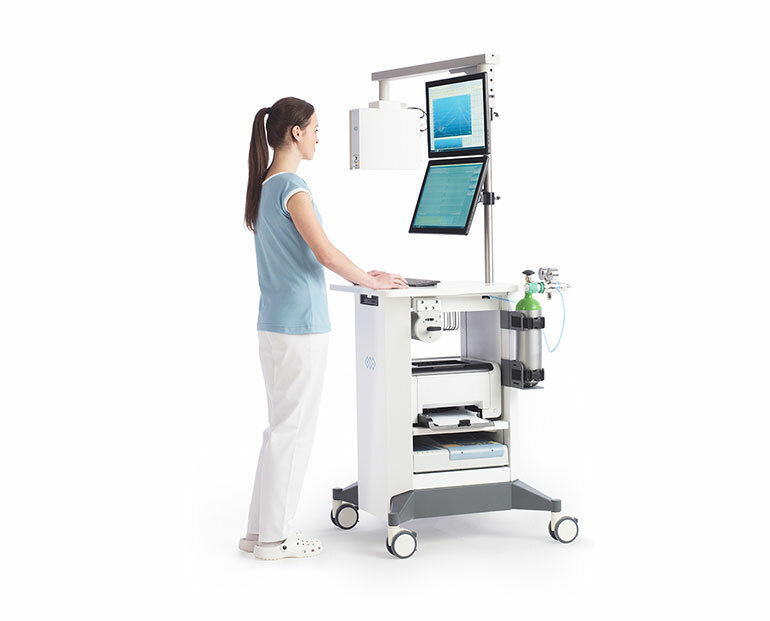
With vertically positioned monitors, BTL CPET allows simultaneous observation of the cardiology and pulmonology data and supports touchscreen operation.
Need product specifications, a list of available models, or a datasheet to help you make an informed decision about the best treatments?
VO2 max
Resting energy expenditure
AT, RCP thresholds
Pulse oximeter SpO2
Automated blood pressure monitoring
Indirect calorimetry
Spirometry

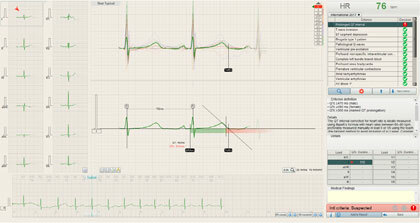
QT MODULE
Provides QT/QTc data for the whole monitoring period. Automatic data interpretation, as well as setting the QTc method according to Bazett, Hodges, Fridericia, and Framingham, are available.
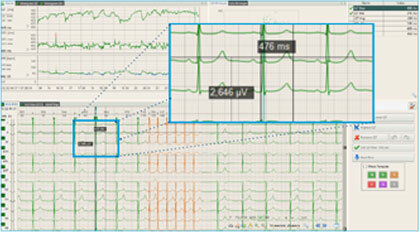
SDS MODULE
Provides both automatic detection as well as manual tools to assess the risk of sudden cardiac death.
RISK OF SUDDEN DEATH
Long QT syndrome (LQTS) is a special heart rhythm disorder that may trigger dangerous ventricular arrhythmias leading to sudden seizures, fainting, or even death.
CLEAR EVALUATION
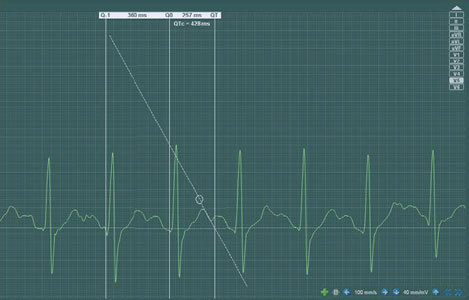
The QT module offers a manual QT measurement using the tangent method. Since this method is rather robust, it is perfectly suitable to handle all the extreme conditions related to common QT measurements.
ADVANCED ST-SEGMENT ANALYSIS
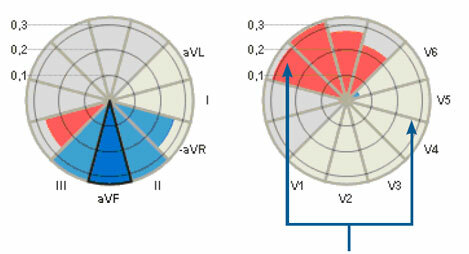
The classic way of graphing an ST segment representation is by using a bar graph. However, a bar graph only shows the amplitudes, while an ST map shows both the amplitudes and the affected areas.
ALL 12 LEADS IN ONE PLACE
The horizontal (top) ST map represents the chest leads, while the vertical (frontal) ST map displays the limb leads. Together it provides a complete overview of the ST-segment in all 12 leads.

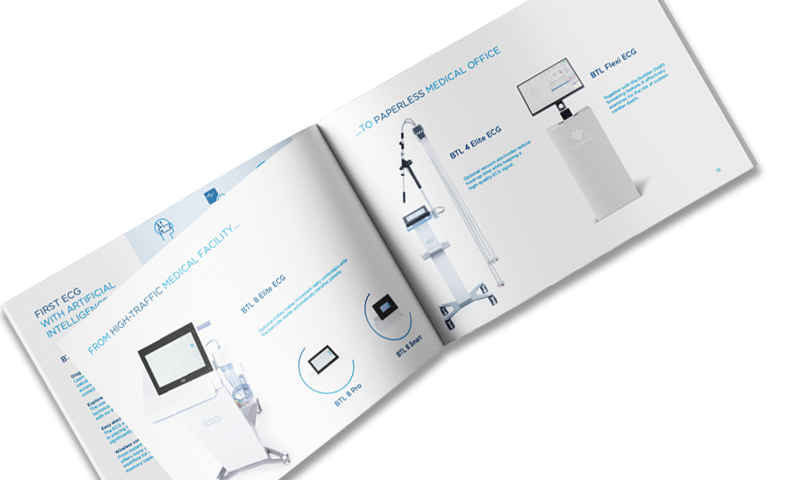
Integrate ECG, stress test, CPET, Holter, ABPM and spirometry into one unified platform, increase convenience in your medical office, and reduce your paperwork to zero.
Please be aware that some of the information / intended uses / configurations / accessories mentioned here are not available in your country. For more information, contact your local distributor. The content of this website is intended for informational purposes only. Not all products and indications are licensed in your country. For more information, contact your local representative. BTL8 ECG is registered in the EU under the name BTL 8 SMART/ELITE/PRO and is intended for the acquisition, processing, recording, analysis, and presentation of ECG data for diagnostic purposes. The device transmits and receives data related to ECG examinations when connected to a compatible software application. BTL® and BTL CardioPoint® are registered trademarks in the European Union and other countries.
We will contact you as soon as possible.